Using the Power of Cryo-EM for Structure Determination at Peak Proteins
Written by Dr. Jack Wright and Dr. Steven Harborne
Over the past 5-10 years, there has been an explosion in the field of cryo-electron microscopy (cryo-EM). The resolutions that can be achieved with the latest state-of-the art equipment and software now rival that of X-ray crystallography. Within Sygnature Discovery, we have recognised that many of our clients are increasingly looking to cryo-EM to address their biological questions and drug discovery needs. Whilst our expertise has primarily focused on X-ray crystallography to date, we are now developing and investing in our own cryo-EM capabilities to support our clients’ requirements. Here we explain what lies behind this shift in balance between cryo-EM and crystallography, and what is involved in tackling cryo-EM for our clients.
CRYSTALLOGRAPHY VERSUS CRYO-EM FROM A HISTORICAL PERSPECTIVE
For decades, X-ray crystallography has been the leading technique for the structural determination of biological molecules, primarily due to the high resolutions that can be obtained. To date, ~171,000 protein structures have been determined using this method where ~900 of these have been reported at a resolution of < 1.0 Å. The technique has been indispensable for developing our understanding of countless biological processes and has been responsible for the awarding of several Nobel Prizes including those associated with structures of ATP synthase, potassium channels, G-protein coupled receptors, and the ribosome. However, X-ray crystallography is not without its flaws.
Critically, its major limitation is the necessity of forming crystals; whilst some proteins crystalise readily, others refuse entirely, thereby eliminating their study by diffraction. Similarly, the formation of crystals typically requires incredibly high protein concentrations which may not be obtainable for some samples. These limitations are underscored by membrane proteins, which often express poorly, and the presence of solubilising detergent can limit crystal packing and interrupt crystal contacts leading to weakly diffracting crystals or preventing crystallisation entirely. Additionally, highly dynamic proteins and/or protein complexes are less likely to crystalise than more rigid/single proteins and are thereby difficult to study using this technique. A secondary limitation for crystallography is the fact that rather than a direct image of a molecule, X-ray crystallography records a diffraction pattern of an X-ray beam as it passes through a protein crystal. The diffraction pattern must then be reconstructed into an image using phase information. Although there are both experimental methods for recording phase information and ways of predicting phases from similarly shaped molecules (phase replacement), it is not always a trivial problem to overcome and can prevent a structure from successfully being elucidated.
Fortunately, many of the limitations of X-ray crystallography can be surmounted by utilising cryo-EM. Cryo-EM is a fundamentally different technique to X-ray crystallography. In a cryo-EM experiment, instead of recording a diffraction pattern, an incident electron beam is passed through a protein sample frozen in an ultra-thin layer of vitreous ice and the resulting scattered electrons are magnified onto a detector where an image is formed. From the series of resulting micrographs, individual images of protein particles in different orientations are averaged together to first build 2D and then 3D models of the protein through a computational process.
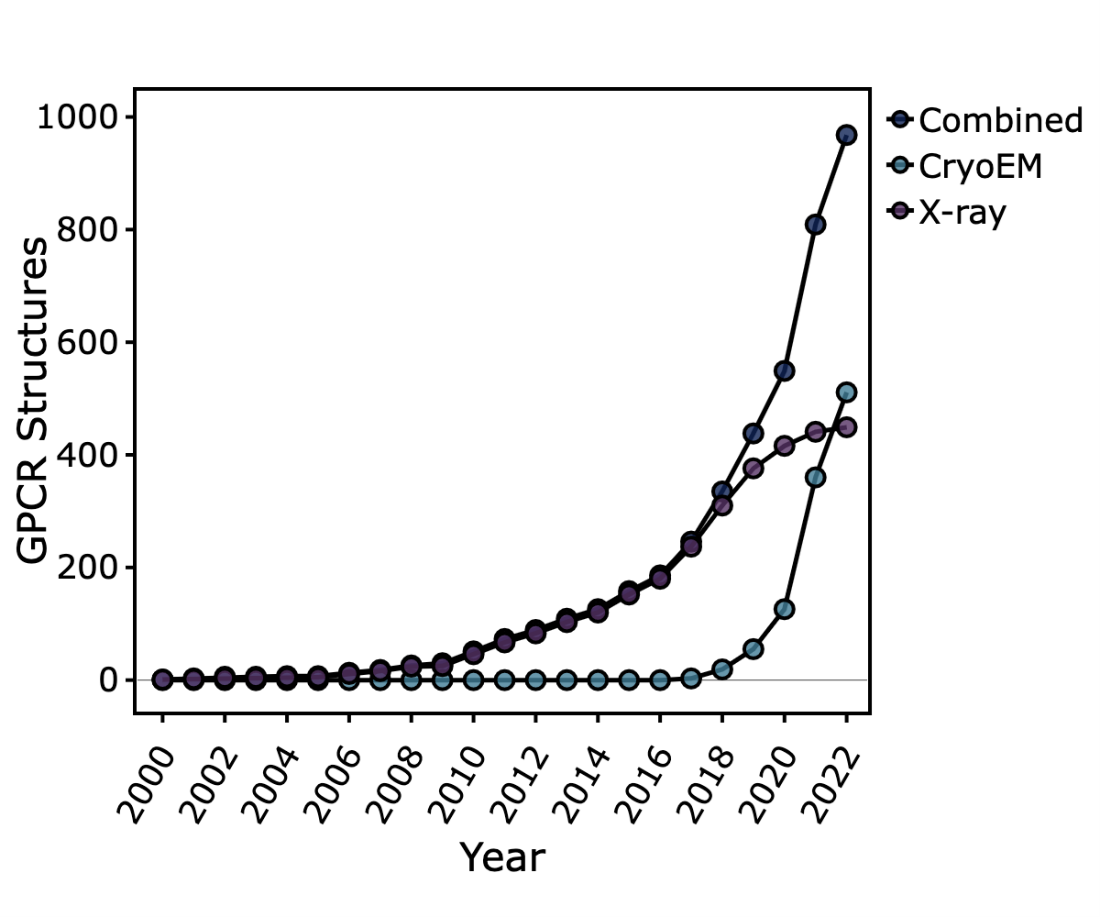
This technique, which has been in development since the 1960s, has in the last decade undergone a series of rapid developments that have confirmed it as a viable alternative to X-ray crystallography for the determination of high-resolution structures, and in many cases, as the more logical option. This so-called ‘resolution revolution’ has been fuelled by several major advances, including the development of direct electron detectors, automated data collection software, improved motion-correction and contrast transfer function (CTF)-correction algorithms, sophisticated particle picking methodologies, single particle analysis software packages, and generally improved access to EM infrastructure. These advances have made it possible to study previously recalcitrant proteins and at resolutions rivalling crystallography; at the time of writing, the highest resolution cryo-EM structure is of apoferritin reported at 1.25 Å. The number of structures being solved by cryo-EM per year is now beginning to surpass those solved by X-ray crystallography as evidenced by the trend observed for GPCR structures being deposited in the PDB, and the rate only seems to be increasing. In 2010, the number of structures solved by cryo-EM was ~300. Today that number is ~13,400.

Scatter graph of the cumulative number of GPCR structures deposited in the PDB over time. The total combined structures are shown (dark blue circles). In addition, the data is also broken down into the number of structures solved by X-ray crystallography (purple circles) versus cryo-EM (light blue circles)
WHAT DOES A TYPICAL CRYO-EM WORKFLOW LOOK LIKE?
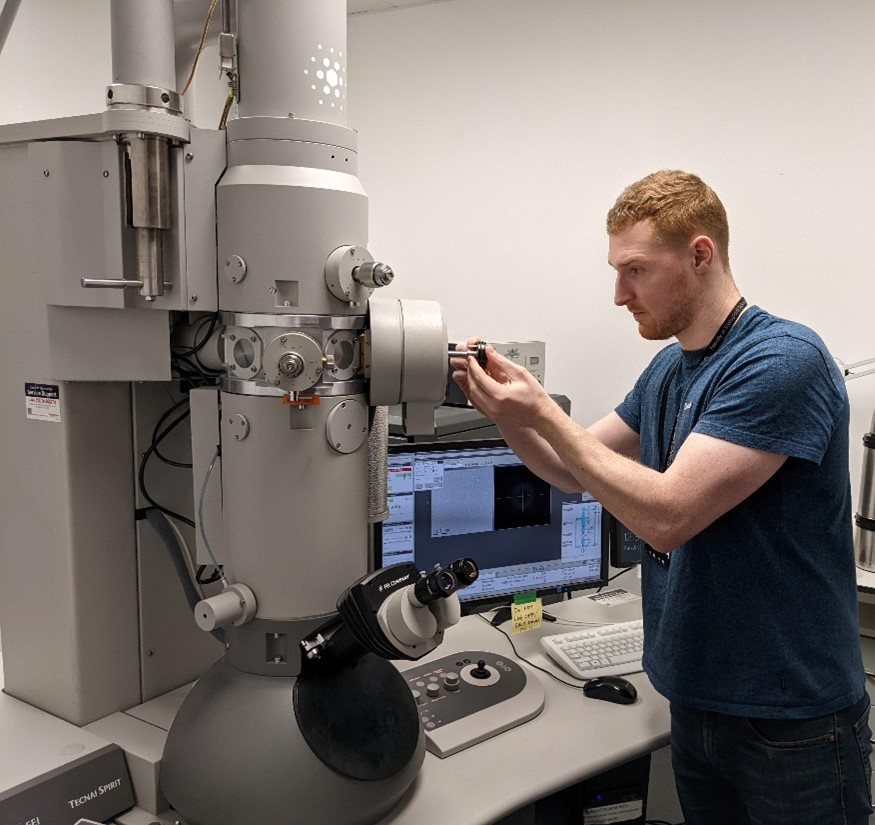
The first step in preparing protein samples for cryo-EM is to prepare negative-stain grids. In this technique, a small amount of the sample is applied to a thin carbon film on a copper grid, which is then stained with a heavy metal salt, such as uranyl acetate. The negative stain provides contrast for the sample, making it easier to see under the microscope. Once the negative-stain grids are prepared, they are used to collect negative stain images of the sample. The negative stain images are two-dimensional and provide a low-resolution representation of the sample.

Image of Dr. Jack Wright using the negative stain microscope at ABSL to screen negative stain grids.
After the negative stain images are collected, they are carefully examined to assess the degree of heterogeneity and polydispersity of the sample, as well as to check for the presence of any aggregates. Heterogeneity refers to differences in the shape, size, or composition of the sample particles, which can affect the quality of the images and make it more difficult to obtain a clear 3D reconstruction. Polydispersity refers to the variation in particle size within the sample. Aggregates, which are clumps of particles stuck together, can also interfere with the imaging process.
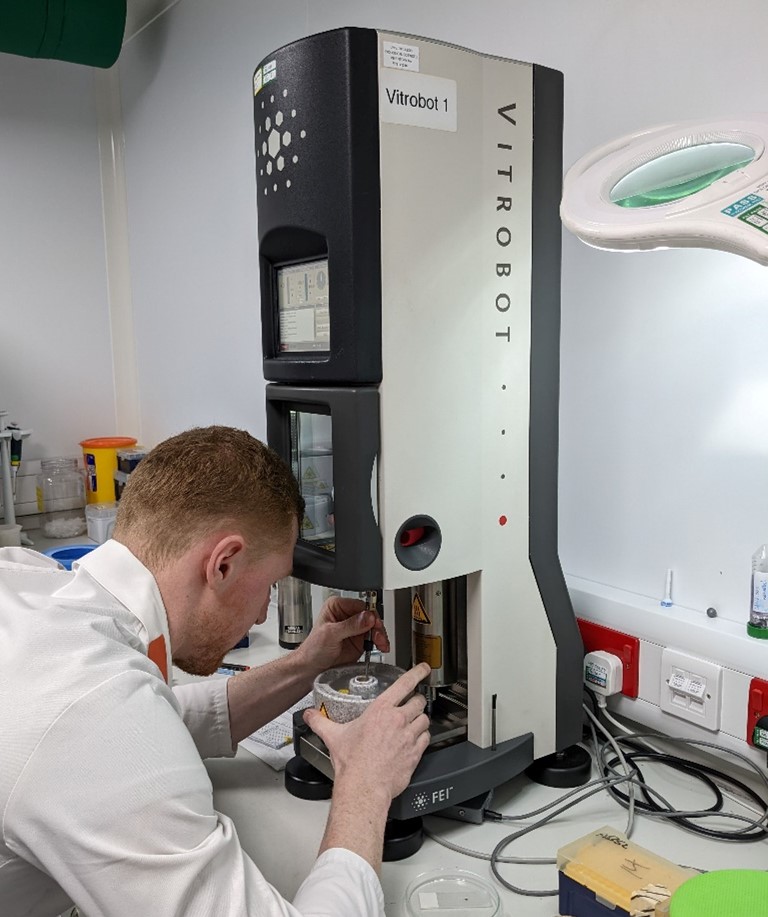
After the negative stain images have been collected and examined, the next step in the workflow is to prepare cryo-EM grids. Cryo-EM grids are prepared using a plunge-freezing instrument, which rapidly the sample in a thin layer of vitrified ice to preserve its native state.

Image of Dr. Jack Wright using the Vitrobot plunge-freezing instrument at ABSL to freeze grids for cryo-EM data collection.
Different types of grids are prepared to determine which one is best suited for the particular protein being studied. For example, Quantifoils and UltrAufoils are commonly used grid types. The optimal grid type may depend on many factors, such as the size and shape of the protein. Another important factor in optimizing grid quality is the concentration of protein applied to the grid; this concentration can be adjusted to achieve the desired particle density on the grid, which is important for obtaining high-quality images. Finally, the particle orientation on the grid must also be optimised, as a bias towards a certain orientation will result in under-sampling of other angular projections that are needed for high resolution reconstruction [1]. Thus, grid optimisation is the most important factor when trying to determine high resolution protein structures [2,3].
Once the cryo-EM grids have been prepared, they are screened by collecting images using a 200-300 keV electron microscope, such as the Titan Krios. During screening, the particle distribution, density, and ice thickness on the grids are assessed to determine whether a full dataset should be collected from the grids and on which grid squares. If the grid quality is good enough and the particle distribution is uniform, a full dataset can be collected from the grids. This step involves collecting multiple images of the sample in a series of different holes in a grid square, ideally with sample frozen in the vitreous ice in different orientations. Cryo-EM data collection typically results in a large amount of raw data.
To generate a structure from the collected micrographs, the first step is to pick particles from the micrographs. This is usually achieved in an automated fashion using neural network-powered software, such as crYOLO or Topaz. These software programs use machine learning algorithms to identify and extract individual particle images from the micrographs, whilst discarding unwanted particles, aggregates, and/or other contaminants.
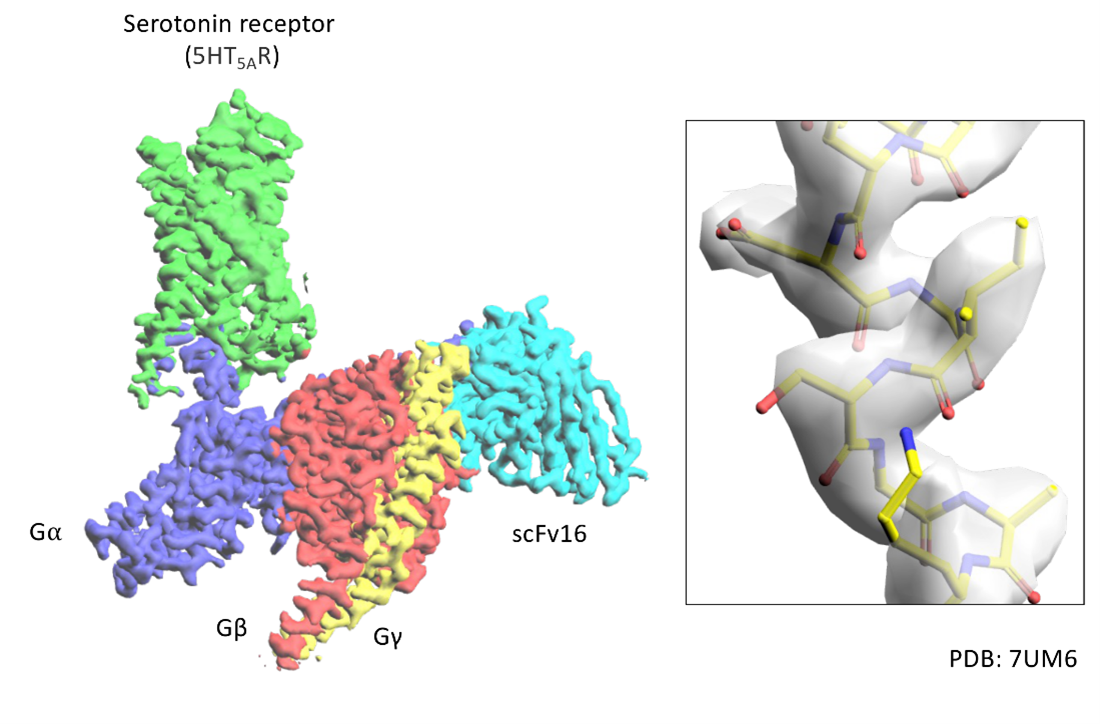
Once the particle images have been picked, the next step is to separate them into 2D classes. Each 2D class represents the average of a stack of particles, and thus, a series of 2D classes can be generated if enough orientations are present; 2D classification is often the first indication if the data set should be processed further. A subset of these 2D classes is then used in 3D classification or 3D reconstruction using software such as RELION 4.0. Since the picked particles represent 2D projections of the original 3D object, it is possible to reconstruct the 3D shape of the object using projection matching algorithms. This is an interactive process in which the 3D output of the first cycle serves as the reference map for the next cycle, until the model no longer improves in resolution. Thus, high quality data can be averaged together as described above to give a high-resolution 3D electron density map for the molecule. This electron density map provides a guide to place and build protein structure into in order to obtain the final structural model. The electron density map is used as a template for fitting atomic models of the protein into the density, and the final structural model is generated by iteratively adjusting the atomic model to fit the density map as closely as possible.

Example electron density maps that can be generated from a cryo-EM experiment. This is example is from a GPCR:G-protein complex structure that shows a GPCR serotonin receptor (green) in its active state bound to a heterotrimeric G-protein at a resolution of 2.8 Å. An example of model displayed in stick representation built into the electron density map is also shown (right panel).
THE FUTURE OF CRYO-EM AT PEAK PROTEINS WITHIN SYGNATURE DISCOVERY
We currently access grid preparation and microscope time through the Astbury Biostructure Laboratory (ABSL) at the University of Leeds, and have plans to expand our network of microscopes where we have industrial access. In the short to medium term, we plan to invest in in-house grid preparation facilities that will begin to address some of the bottlenecks faced in our current cryo-EM workflow. In the longer term, bringing the microscopes in-house may also be advantageous, but is very dependent on the balance between the heavy investment in facility space, hardware and operational costs of such a setup versus our ability to lease microscope time at public facilities.
The computing power required to process the large datasets produced by cryo-EM experiments is also an element we needed to consider. Without any existing high performance computing resource at our disposal, we have opted for a flexible and scalable approach by leasing cloud compute resource through Amazon Web Services (AWS). This solution gives us a myriad of advantages over investing in physical local hardware, including the resource being immediately available to us with no lag time for installation of hardware. The resource is available on demand, but can be released when not needed, so we only pay for compute resource used. Furthermore, in essence, the resource is infinitely scalable, as more resource can be leased on demand as our processing needs grow. Finally, the system is future proof, as we will be able to choose to lease the latest and most powerful hardware as it becomes available on AWS, and thus not be constrained to a local physical system.
HOW CAN I APPLY CRYO-EM TO MY PROJECT?
If you have a structural characterisation project that you think would benefit from either an X-ray crystallography or cryo-EM approach, then please do get in touch with us and we’d be happy to discuss. info@peakproteins.com
References
[1]. Drulyte, I. et al. Approaches to altering particle distributions in cryo-electron microscopy sample preparation. Acta Crystallogr. Sect. D Struct. Biol. 74, (2018).[2]. Kampjut, D., Steiner, J. & Sazanov, L. A. Cryo-EM grid optimization for membrane proteins. iScience 24, (2021).[3]. Weissenberger, G., Henderikx, R. J. M. & Peters, P. J. Understanding the invisible hands of sample preparation for cryo-EM. Nature Methods vol. 18 at https://doi.org/10.1038/s41592-021-01130-6 (2021).

