Using Design of Experiments to Improve a Protein Purification Protocol
When your aim is to optimise a particular process, a Design of Experiments (DoE) study is a powerful tool to achieve this in the most efficient manner. In this case study we describe a relatively simple DoE study we performed for a client. However, there is a twist in the tale; biological systems are never quite as straightforward as they first seem.
For an introduction to DoE please see our blog and the references therein.
Some background to the project
The overall goal of the project was to modify a laboratory scale process to express and purify a target recombinant protein such that it is suitable for large, manufacturing scale production. Working to that end we performed experiments to:
- Simply the process and reduce the number of steps involved
- Remove steps that are not ideal for running at scale (such as a size exclusion chromatography step)
- Replace chemicals with high COSHH ratings or that are toxic to the environment
- And to replace chemicals and consumables that are expensive
The outcome of this work is that although it is still a complex process, it is much simplified from what it was originally and is still capable of producing the target protein with excellent purity, good yields and most importantly full activity.
The challenge we are working on now is to establish how robust the process is; to define what are the most influential factors in the process and what the ranges of the key factors are that we can operate in without compromising activity and ideally to improve the yield still further. To tackle that in the most efficient way, we are applying a DoE approach.
How to choose which DoE design to use
We always take a lot of care in selecting the particular DoE design we will employ for a study. There are several common designs available and each have their various pros and cons. The choice ultimately comes down to a balance between the logistics of running the individual experiments, how many runs you can “afford” do to versus the statistical power of the design. How complex are both the experiments to run and the analytical methods needed? How much resource and time do they take to perform? How many different factors do you want to study? Versus, do you need to know about quadratic effects and factor interactions or do you just need to know which are the most influential factors?
For this project, the individual experimental runs are relatively complex and take 2 days to complete. Even running in parallel, we could only perform an absolute maximum of 13 runs. We are still early on in our process optimisation, so at this stage the main question for us is which factors are the most important and we have identified 4 from our previous experience that we consider to be likely candidates. A full factorial DoE with each factor at just 2 levels would take 16 runs, which although tempting to push for, was really just too much for our available resource. For those reasons, we chose a Definitive Screening Design (DSD), with the addition of a centre point. Analysis of the power of the design (Fig 1), showed that the main factors were fully represented and there was minimal confounding of the 2-way interactions, a compromise we were happy to live with at that stage.
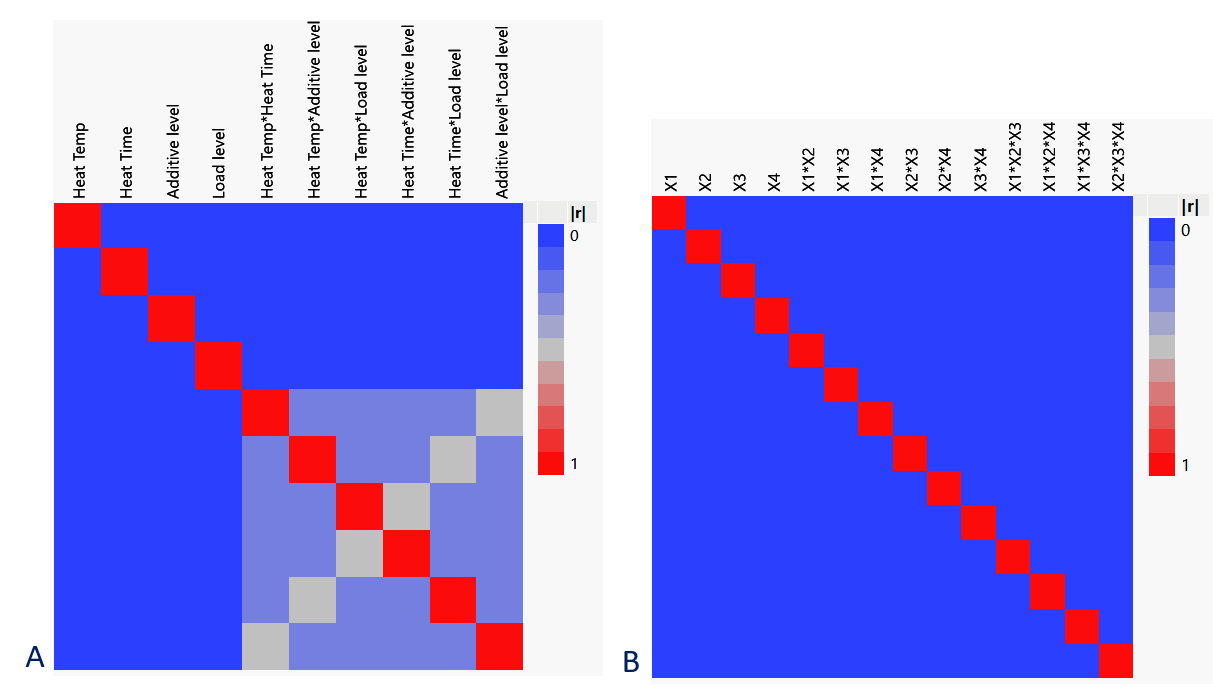
Figure 1: (A) Power analysis of the DSD design showing all main factors represented (dark blue) with minimal confounding (light blue, grey) of the 2-way interactions. Compared to (B) an equivalent full factorial design that would require 16 individual runs.
We used JMP software to create a DSD study design for our DoE studies. The 4 factors we were looking at were a heating step where we were looking at both the temperature and heating time, the level of a buffer additive and the load level on to a chromatography column. Each was set at a high and low level (based upon previous data) and we also included a centre point run. The design and experimental plan generated by the software is shown in Fig 2.
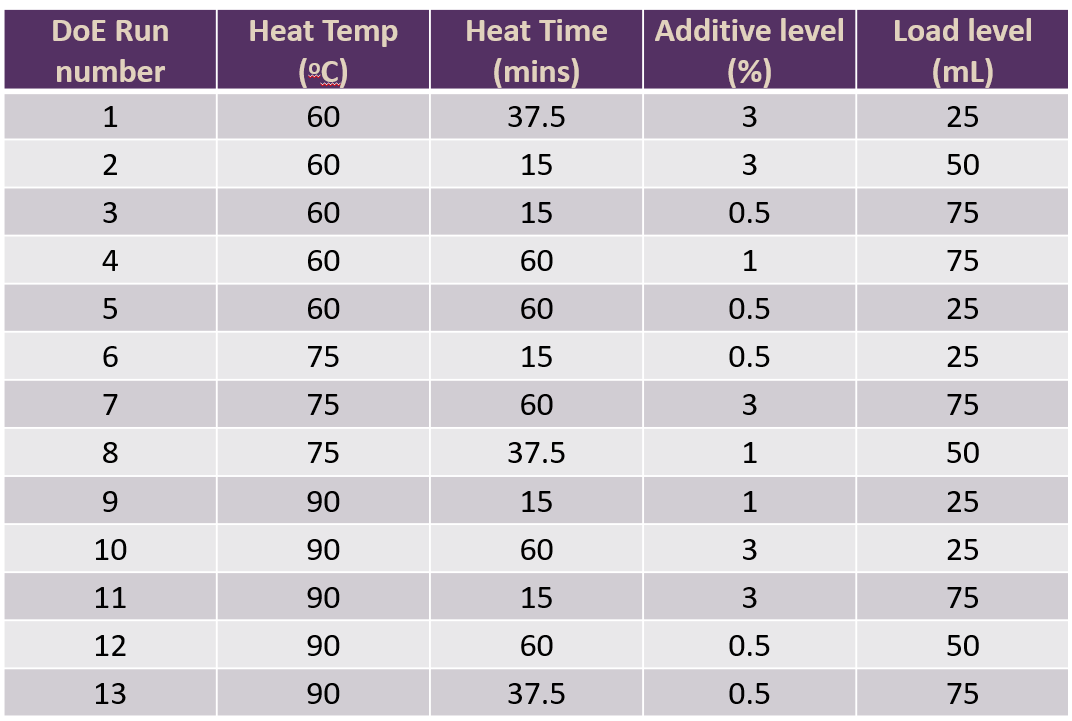
Figure 2: DSD design generated by the JMP software for 4 factors at 2 levels with 1 centre point condition.
Steps to interpret DoE data in JMP
The 13 runs for the DSD study were performed and we analysed the final protein samples obtained, not just for the yield of our target protein, but also for purity, the level of nucleic acid contamination (via A260/A280 ratio) and activity. DoE experiments are often much more powerful and informative if several outputs can be evaluated in parallel, but obviously this additional analysis costs time and resource. For this case study, we have focussed on the process we used to interpret the yield data.
The first step was to graph the data with simple X-Y plots (Fig 3), to give an indication of trends and see if there were any obvious outliers in the data that we should be mindful of during the statistical analysis. There was one condition that showed a high yield (17.4 mg) and another that was low (0.1 mg). These were born in mind during the subsequent analysis, but looking at the detailed experimental data, these were not considered to be abnormal or failed runs. i.e. we do not think any special cause variation occurred during the study.
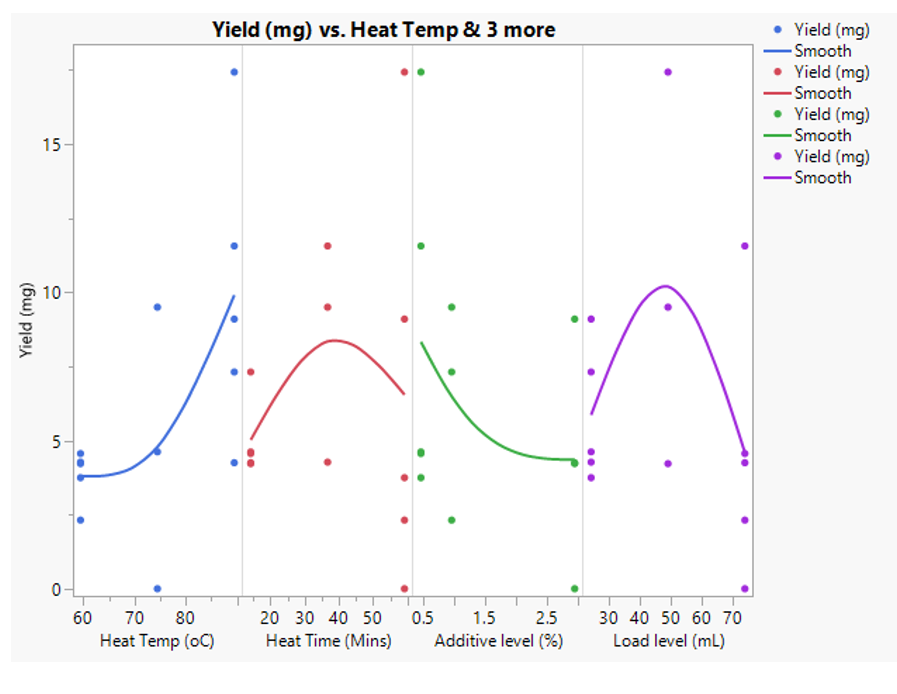
Figure 3: XY Graph plots for yield (mg) of target protein for each of the four factors studied
The second stage was then to evaluate how reliable the model was. For this we ran a least square analysis in JMP with all factor (main effects) and also the 2-way interactions that are covered by the model (see Fig 1a). What we initially look for is a high (near to 1) R-squared value in the actual by predicted plot and a low <0.05 P value.
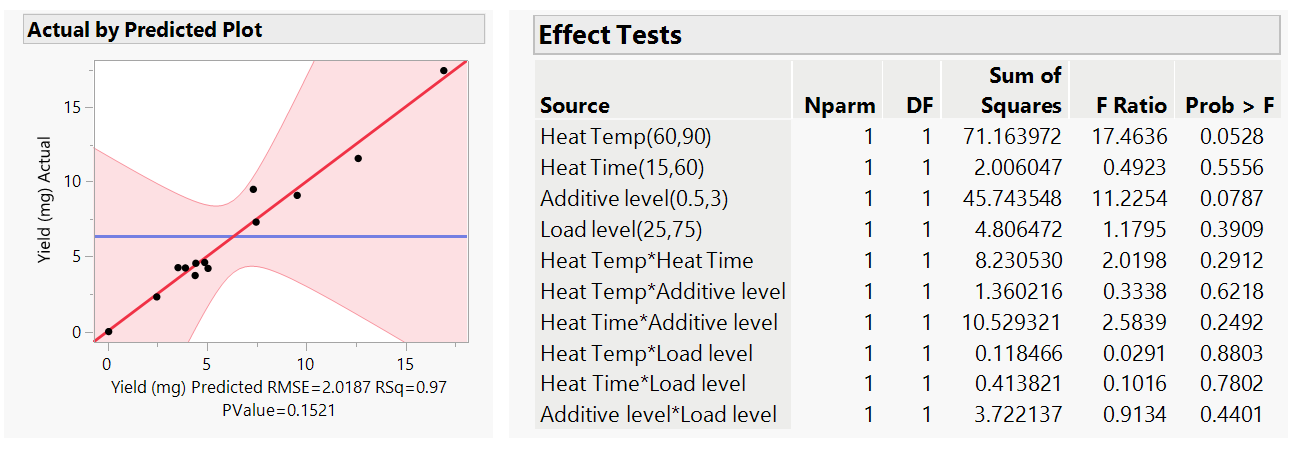
Figure 4: Least square analysis with all factors and 2 way interactions
For our yield data, the R-squared is 0.97 with a P value of 0.1521 (Fig 4). This indicated that the model was good and can explain 97% of the variation observed in the data. The main factors that affect the yield, shown by those with the lowest P values, ideally below or at least near to 0.05, were temperature and the concentration of the additive, with no high statistical impact given by the other 2 factors. Similarly, at this stage there were no 2-factor interactions observed (all P value >0.05). We often refine the model at this stage by removing the non-significant factors from the analysis as this can improve the overall accuracy of the model. In this case, we removed 2-factor interactions with the highest P value >0.7, the Heat Temp and Heat Time both with the chromatography Load Level, especially as experimentally these are unlikely to be linked. The result was an improved model (Fig 5. P value of 0.011 which is well below 0.05) that now shows the main factors, Heat Temp and Additive Level, that have a statistical impact (P <0.05) on yield and revealed that there are two 2-way interactions in our system, Heat temp with Heat time and Heat Time and Additive level.

Figure 5: Least square analysis for the refined model.
Overall conclusions
This DoE study has shown that to improve the yield of our target protein, the factors we should focus on are the heating temperature and the concentration of the additive. Furthermore, for the other 2 factors, we can operate in any of the ranges tested (heat time 15 to 60 minutes, column load 25 to 75mL) without adversely impacting the yield. And finally, that there are two 2-way interactions within the 4 factors that we should be mindful of. JMP has a nice “prediction profiler” function. Using this, the model predicts that for optimal yields, if we set our Heat Temp to 90°C and the additive level at 0.5% we should be able to achieve a yield of 17.3mg
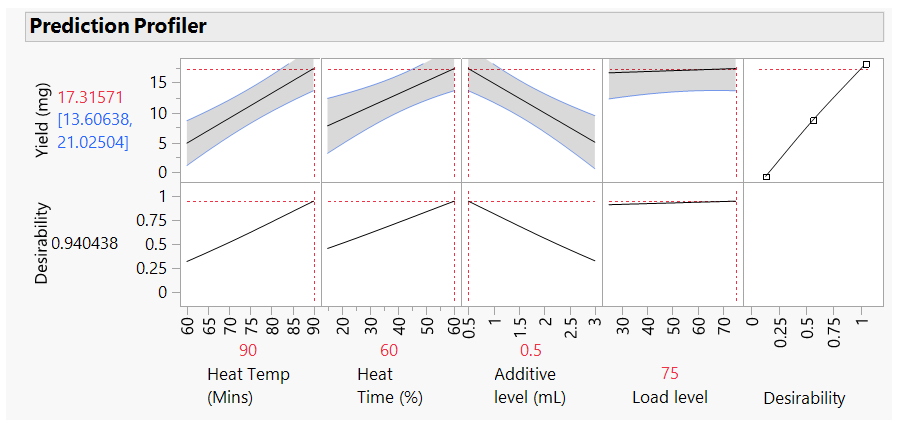
Figure 6: Prediction profiler with factors set for maximum yield
DoE is not always plain sailing
If only it were that simple. When we analysed our data for the other outputs, a more complex picture emerged. The factor settings to obtain the maximum purity were the same as to obtain maximum yield. However, to reduce the level of nucleic acid concentration we need to operate at the lower temperatures for a shorter time. Therefore, we will have to compromise yield to maintain our target low level of nucleic acids. For activity of the target protein, which is our key output, the high temperature settings unfortunately completely destroyed the activity. Upon further investigation, this occurred as a result of a slight change in the way we ran the experiments in the DoE study. In our previous experiments we were running with larger volumes. For the DoE to run several samples in parallel, we performed this step with smaller volumes in a water bath that meant that the actual sample temperature was higher than in our initial runs and high enough to be a point of failure; still good information, but it compromised the DoE study for that output. Fortunately, there were still 3 conditions that gave us excellent activity (in fact better than we had achieved to date). So, temperature control is where we are focusing our efforts for the next round of experiments.
How can I apply DoE to my project?
If you have a protein expression and purification project that you think would benefit from a DoE approach, then please don’t hesitate to get in touch with us. info@peakproteins.com


