Sometimes a dash of salt is all it takes
The effect of ionic strength on protein stability
At Peak Proteins we often say that every protein is an individual and they all have their particular nuances and quirks. Once in a while there is a simple solution to a challenge we come across with a protein target, but the trick is to have that awareness of how the protein is behaving to actually implement the simple fix, rather than go down a more complicated route (re-engineering the construct for example).
In this case study the protein construct in question was proving to be unstable and forming aggregates during concentration for a final size exclusion chromatography (SEC) step.
To obtain the optimum separation on a size exclusion column it is best to inject the sample in as low a volume as possible. The typical recommendation for most SEC columns is for the sample injection volume to be less than 5% of the total column volume. Therefore, in this example the protein was concentrated to around 1 mL after nickel affinity in preparation for size exclusion chromatography. At this stage the protein was being concentrated in a buffer containing 200 mM NaCl. The protein remained in solution and seemed to be stable and the concentration was around 12 mg/mL.
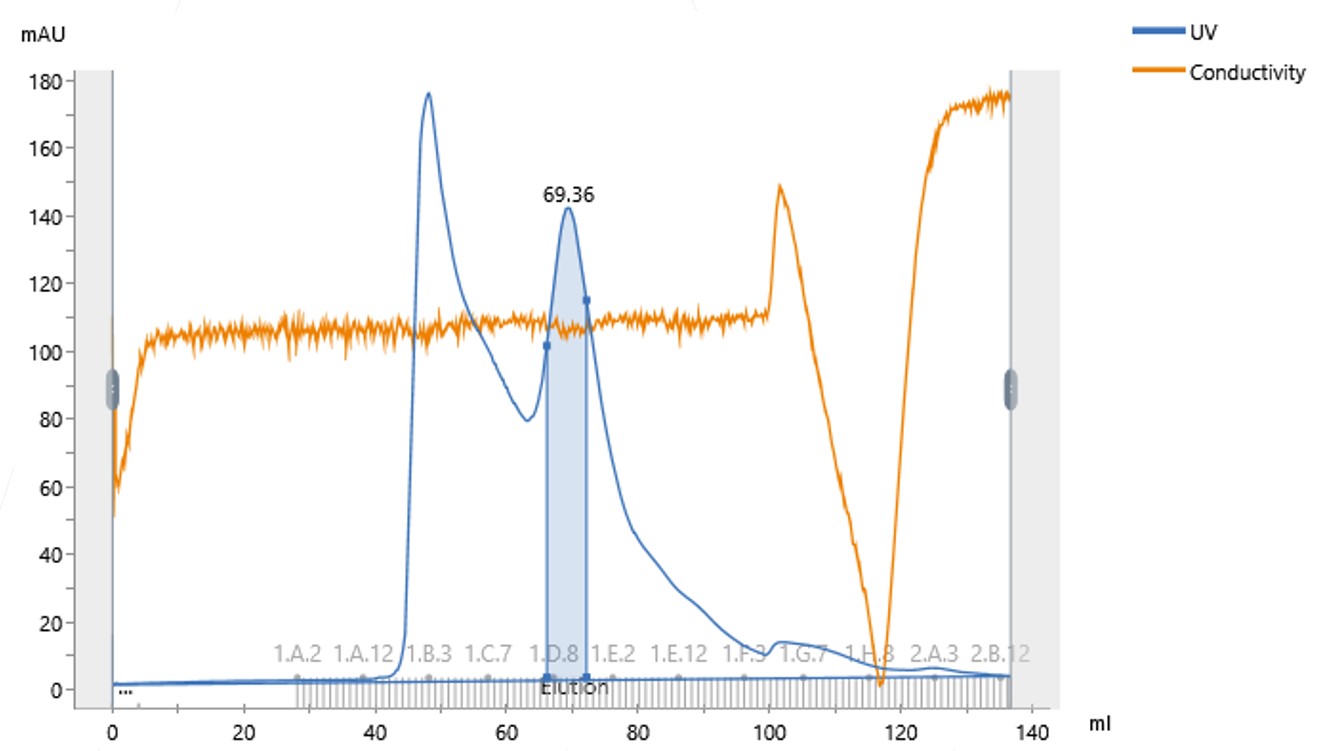
However, when it was run down the size exclusion column, it was revealed that a large portion of the protein had formed soluble aggregates, observed as an initial peak running at the void volume of the column (Figure 1).

Figure 1: Size Exclusion Chromatogram of the Protein Concentrated in 200 mM NaCl
The monomeric, usable protein had eluted at around 69 mL from the 120 mL size exclusion column. From an SDS-PAGE gel, we saw that the initial main peak eluted at the void volume, around 50 mL, and contained aggregated, unusable protein. Around 80 % of the protein had been lost as these soluble aggregates.
Often in these situations, we would look to do a Thermoflour screen to explore buffer conditions, pH, ionic strength, additives etc. If that didn’t work, we might even consider re-engineering the construct to try and find a more stable form of the protein. However, in this case when we reviewed our data with some related proteins, we noticed that some of them had been stable in buffers containing higher levels of NaCl.
Luckily, we had only processed a part of the sample, so took another aliquot of the Ni affinity column pool and this time concentrated it in a buffer containing 400 mM NaCl. Once again, the protein seemed stable and remained in solution at this stage.
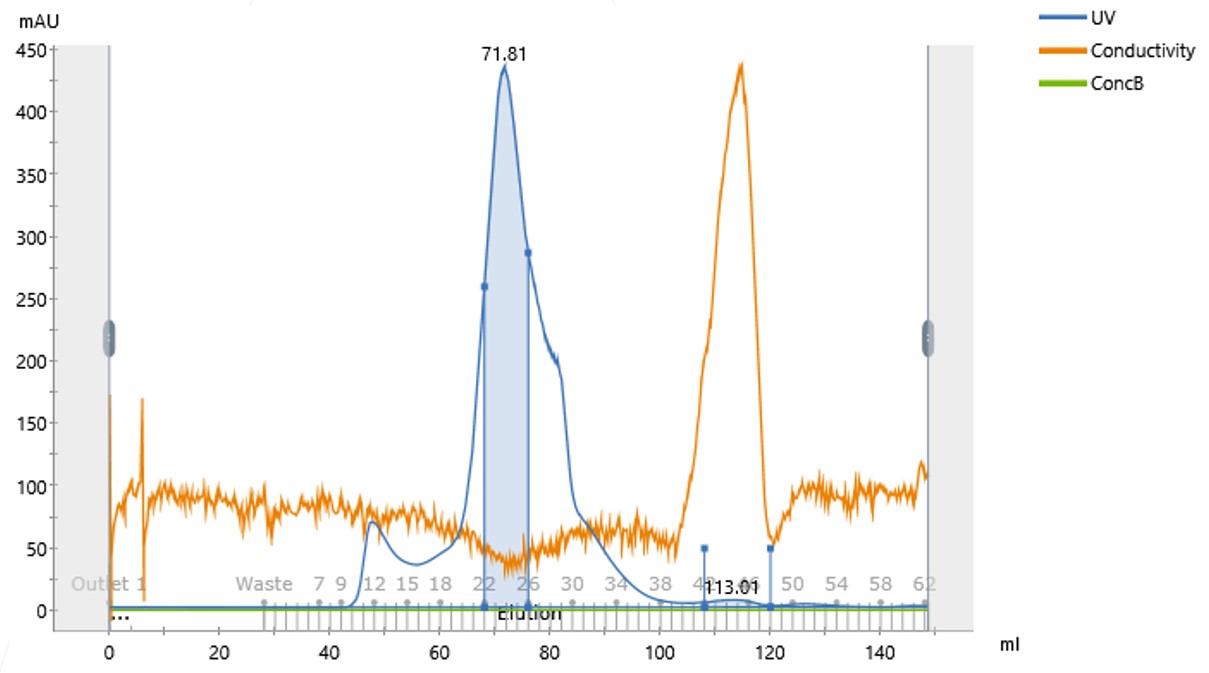
The 1 mL concentrated protein was injected onto the 120 mL size exclusion column and this time a much-reduced leading peak at the void volume, at around 50mL, was observed and the main peak this time was at 72mL where we expect the usable, monomeric form to elute. (Figure 2).

Figure 2: Size Exclusion Chromatogram of the Protein Concentrated in 400 mM NaCl
The Outcome
Increasing the concentration of the NaCl from 200 mM to 400 mM as the protein was being concentrated, greatly increased the protein stability and so the yield of the protein of interest.


